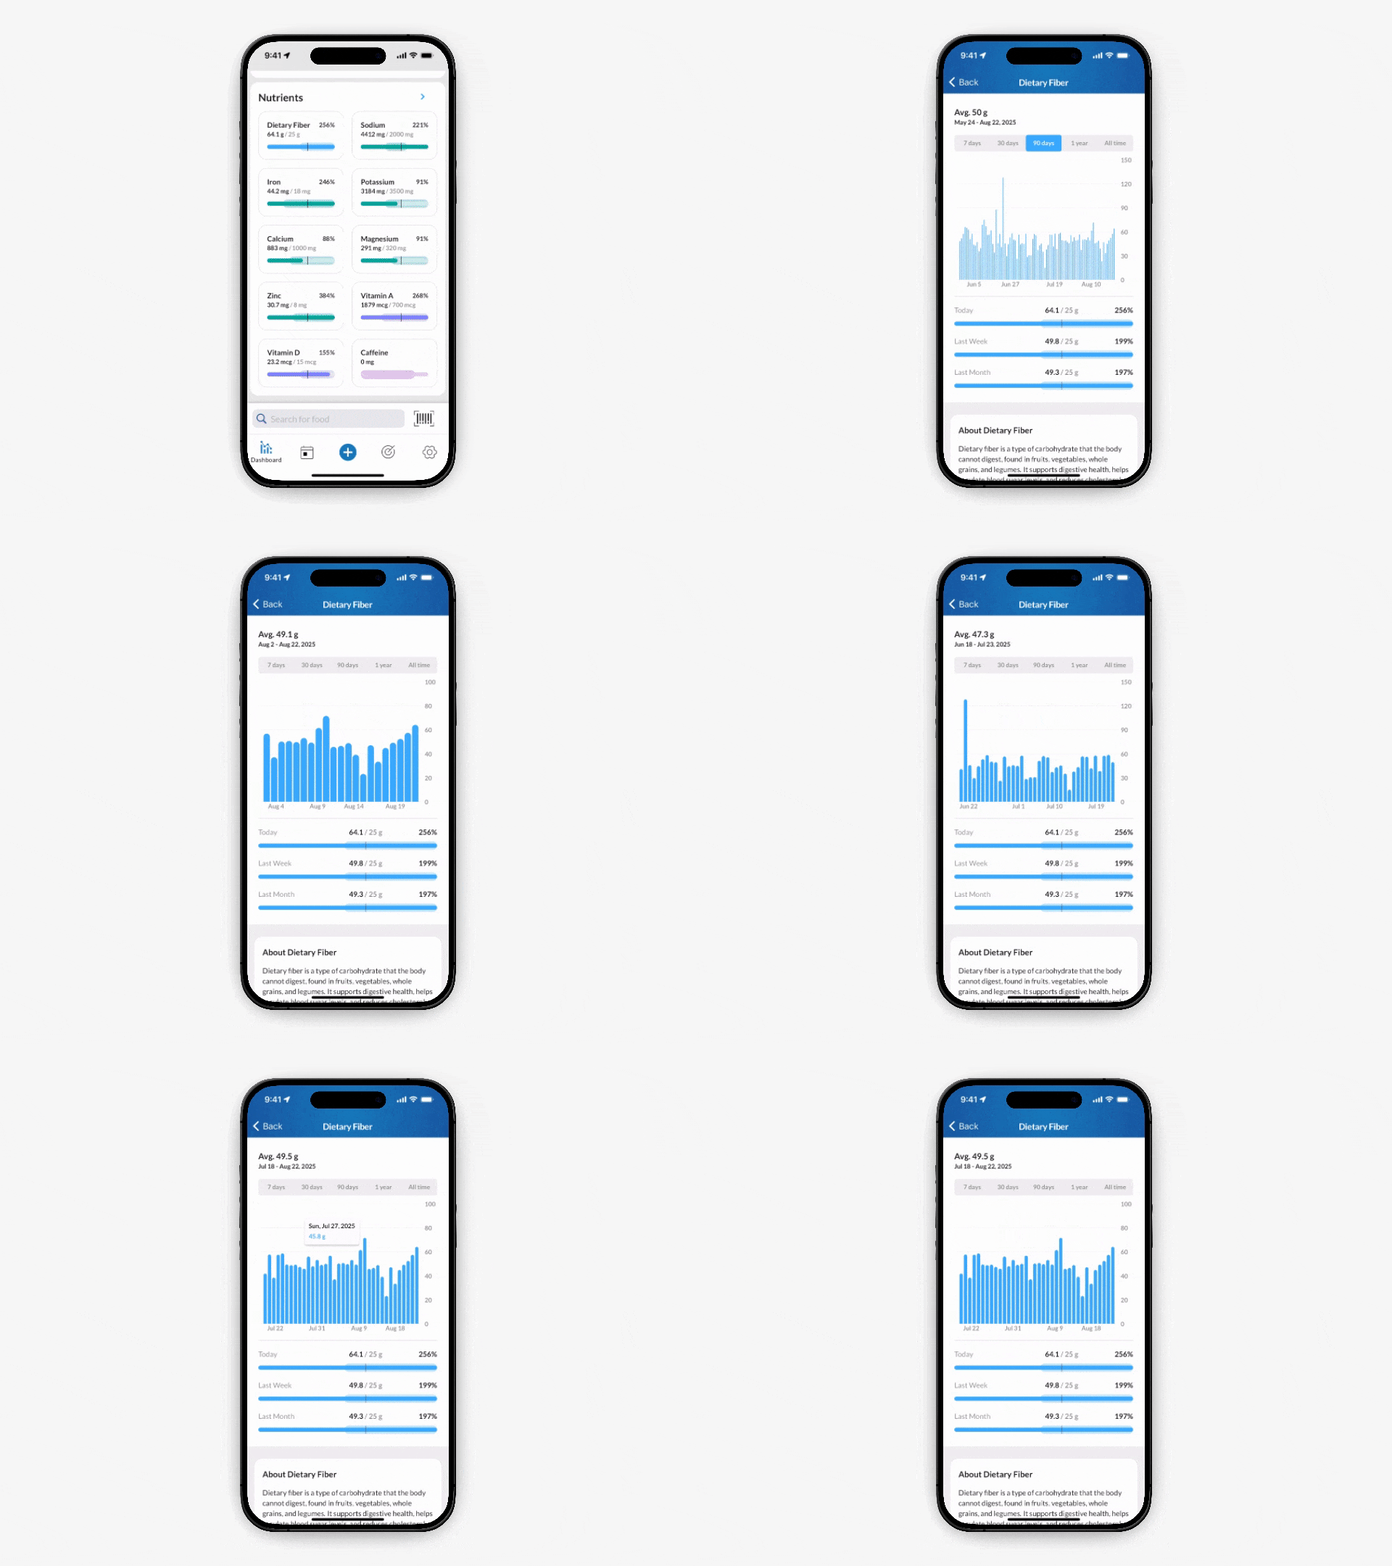
The nutrient charts give you a flexible way to explore your nutrition data over time. You can adjust the date range and interact with the charts in several ways:
Select a preset range: Tap any of the options above the chart (e.g., 7 days, 30 days) to quickly change the time frame.
Adjust the time scale: Place two fingers on the chart and pinch them together to view a longer range, or spread them apart to view a shorter range.
Scroll through time: Drag your finger left or right on the chart to move forward or backward.
View daily details: Tap and hold on the chart to see nutrient values for a specific day, then drag your finger to move across days.
As you adjust the date range, the average nutrients displayed above the chart will update to reflect the period you’re viewing.
