With nutrition trend reporting, you can explore your macronutrients over time, including averages.
On the Dashboard, you can view the current week's nutrition history, including:
Total calories consumed vs. daily goal
The composition of calories by macro per day
Average nutrients consumed in the last 7 days
Today's date, as well as empty days when no food is logged, is excluded from the calculation of averages.
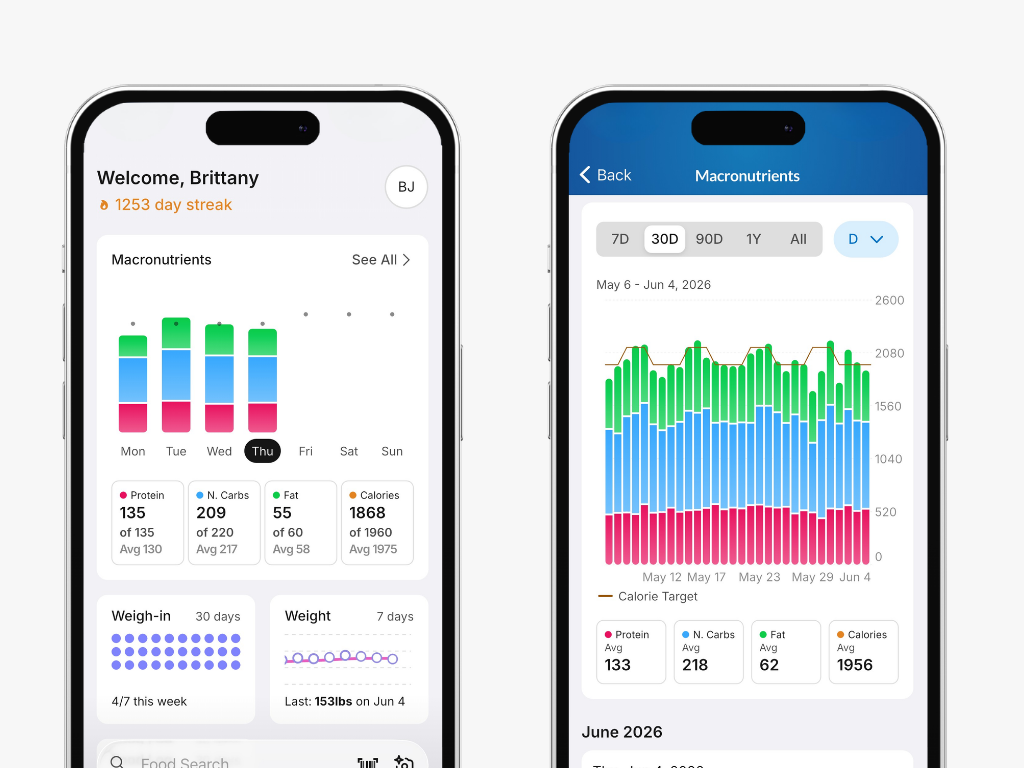
Premium members can tap into the Macronutrient block to access an interactive charting experience that lets them view their nutrient trends, including averages, over any date range.
Tips to navigate the chart:
You can change the date range presented in the chart by:
Tapping any of the presets below the chart
Using two fingers to pinch to zoom in or pull apart to view different lengths of time
Tap and drag your finger on the graph to move forward or backward in time
As you change the dates presented, the average nutrients shown above the graph will also change.
You show or hide any nutrient by tapping on its label above the graph. For example, if you just want to drill into Fat consumption, you could disable the display of P, C, and Calories.
Tapping and holding on the graph will show the nutrients for each day. Drag your finger to show the nutrients for different days.
This same trend reporting is available when viewing a Friend's account.